Remote working in a pandemic

Remote Working during a Pandemic By Tanya McDonald, Marketing Executive, IMGS Last year on March 12th the Taoiseach of the time, Leo Varadkar, gave a landmark speech from Washington announcing a raft of Covid restrictions for Ireland, which included the closure of schools and a switch to remote working for those that could. Little did […]
Keith Duffy, I.T. Grad, IMGS
IMGS Staff Profile Keith Duffy, I.T. Grad Can you describe your role at IMGS? I work as a developer for IMGS. Since arriving a little over 6 months ago, I have done a mix of both front and back-end development. For my first project after joining, I was tasked with designing and building a new […]
Women in tech at IMGS – Aoibhinn Stuart
Women in Tech at IMGS – Aoibhinn Stuart, Delivery Director. To celebrate Women In Tech at IMGS and their invaluable contribution to the business, we will be turning the spotlight on key female members of our tech team over the coming weeks. This week’s Women in Tech spotlight interview is with Aoibhinn Stuart, Delivery Director, […]
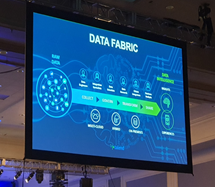
Moving to the Cloud by Ciaran Kirk, Operations Director, IMGS

Moving to the Cloud is a key part of any digital transformation.
FME 2020 by Gavin Park, Lead Solutions Consultant IMGS

FME Desktop 2020.0 It’s likely that 2020 will be remembered for a long time so it is perhaps fitting that the focus on the FME 2020 release has been finding your data zen and making working with data even easier. FME started 2020 ready to prove it had come of age and was no longer […]
Talend Engage Conference by Garrett Cronin
Ciaran Kirk & I were fortunate to attend the Talend engage conference in New Orleans last month. The event saw Talend staff, partners and customers from across the globe converge on the Marriot New Orleans for three days of networking, information sharing and to get inspired with Talend.
Sisense Bootcamp in Israel by Ellen Noone

Sisense Bootcamp Israel On day one of the Sisense bootcamp in Tel Aviv, Israel, myself and Ciaran arrived at the Atrium Tower to start our bootcamp. We were immediately wowed by the impressive skyscrapers and towers surrounding us. The building hosting us, had 40 floors and we were on floor 16. We were met by […]
Gavin Park, Lead Solution Consultant, IMGS
Can you describe your role at IMGS? Probably what most people will know me for here is training and consultancy on Safe Software’s FME products, as that tends to keep me busy and out seeing our different customers. Its also been a great way to see different parts of Ireland! Though I’m getting more involved […]
Safe Software Summit 2019

By Garrett Cronin, Senior Account Manager IMGS I was fortunate enough to be able to travel to this year’s Safe Software Partner Summit in Vancouver. The annual Safe Software Partner Summit is the largest meeting of Safe Software staff and partners from around the world. As per previous years, it was hosted in the beautiful […]
Tanya McDonald, Marketing Executive IMGS

Can you describe your role at IMGS? I hold the position of Marketing Executive at IMGS, with key responsibility for Event Management, Branding, Marketing and Sales Support.